The Statistics area is here: discover a new way of analyzing and improving engagement
The statistical report is often thought of as a point of arrival. It’s that final step in a campaign or strategy. But from now on, reports are the new starting point. They are the tool from which even more engaging communication emerges.
Today, we present you with a great MailUp platform novelty: the new Statistics area. Without a doubt, this feature will revolutionize your results measurement activities. It offers you all the tools to analyze the progress of campaigns that have been sent and to calibrate those to come.

From developing integrations to strategic support, from creating creative concepts to optimizing results.
Objective ? Convert results into even better performing campaigns
The new Statistics area was redesigned not as a simple and passive report collector but as an active analysis system capable of offering companies information and trends that guide subsequent campaigns.
Part of a platform development path to make data-driven campaign creation tools available, the new Statistics area stems from the awareness that better performance comes from knowing one’s audience.
We now offer the fruits of a work that led to the creation of new reporting systems, a complete area redesign, and navigation between pages. This ensures an enhanced user experience, in-depth knowledge of how your campaigns went, and how to intervene to improve future results.
What you can do with the new Statistics area
Know the recipients’ activities and engagement, and segment campaigns accordingly
Tools:
› Individual recipient reports are kept for up to a year
› New reports and Engagement filters
Individual recipient reports are kept for up to a year
We know how valuable each recipient’s results are, not in and of itself but as a basis for the creation of filters, automatisms, and segmentations calibrated on the behavior of each contact and its degree of e-mail interaction.
To further enhance this, we have extended MailUp’s data retention period from 15 up to 365 days, depending on the platform’s edition.
What are the individual contract-related detailed reports for, in practice? Filter recipients based on their e-mail activity: opened or not, click, open without a click, and so on.
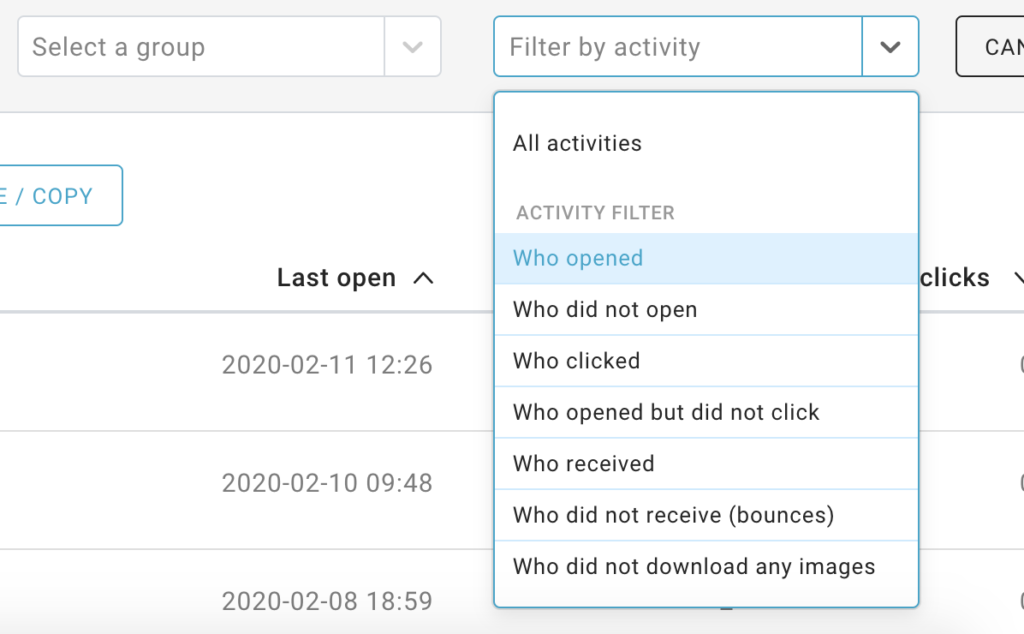
Once the filter is selected and applied, it’s possible to move the segment of recipients obtained into a new or existing group. Direct campaigns can then be tailored to that behavior.
For example, it’s possible to create an automatism and send a re-engagement e-mail to contacts who opened a specific message six months ago or sent a discount coupon to the most active customers during the last year.
New Engagement reports and filters
You might remember that in October 2019, we presented Engagement, a platform section that provides advanced statistics on campaign progress and engagement level. This means that mailings can generate interest among recipients in terms of content and offers, as shown by the degree of message interaction.
We’re now introducing an integration and complement function. Starting today, those who’ve activated Engagement will find a new set of filters on the platform in the Recipients > Filters section. This enables you to utilize the information collected in the Engagement reports and create recipient segments based on a set of conditions:
- Very active recipients
- Active recipients
- Somewhat active recipients
- Inactive recipients
- New recipients
- Inaccessible recipients.
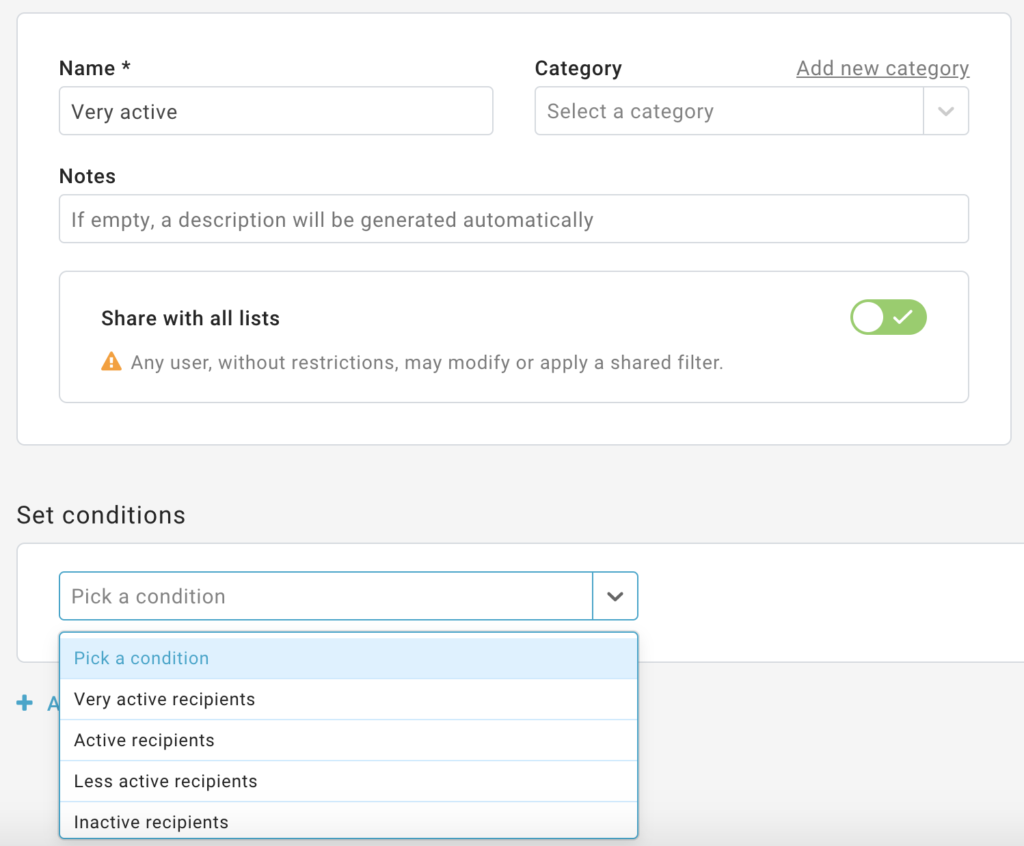
The Engagement filters make it possible to create ad hoc campaigns tailored to the degree of involvement. Just choose the filter, and MailUp will take care of providing the recipient cluster.
Engagement reports and filters are available in MailUp Premium. It offers the full professional solution for converting customers into promoters and multiplying revenues.
Have full control over campaign results
Tools:
› Optimized reports for message and sendouts
› More intuitive aggregated reports
› New List overview
› Optimized calculation
› New notification center
Optimized reports for message and sendouts
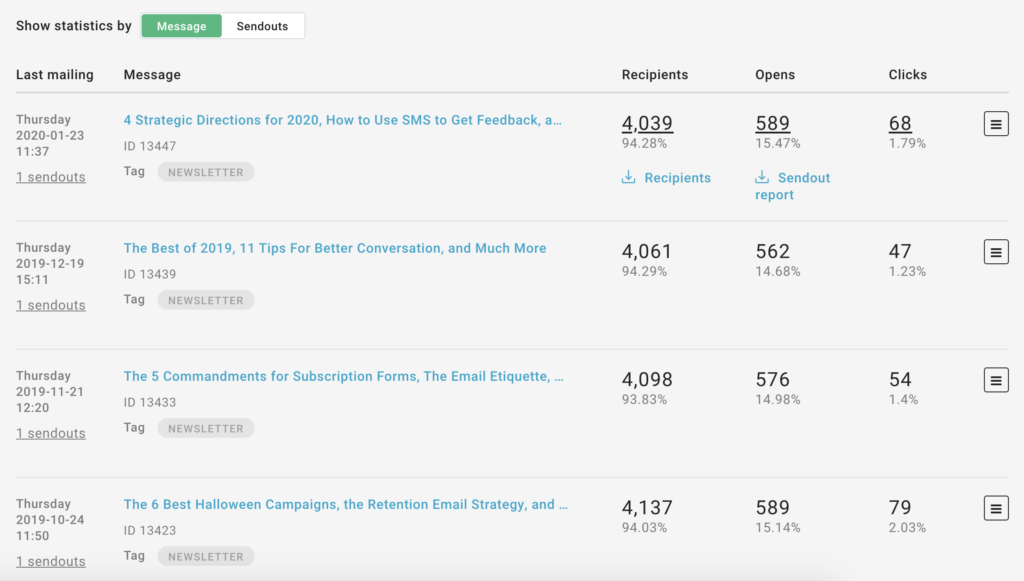
We have divided statistical reports as followsto offer even more control over the results of each mailing:
- Message, so that you can view the results of an e-mail’s entire life cycle. Without limitations, this report aggregates the results of all separate mailings from the same message (on the summary page) for the data retention period.
- Sendouts, to consult a separate report for each mailing of the same message. This is very useful for those who adopt, for example, automation tools (triggering periodic sendings of the same e-mail) and for those who send the same message several times.
Simply click on the buttons located above themessage history to view reports by message or mail.
Moreintuitive aggregated reports
We also got a grasp of aggregate reports. Besides being more intuitive and straightforward, they can now aggregate up to 100 messages.
This way, you can create aggregate reports periodically by measuring the strategy’s long-range performance: every month, every three months, every six, or annually. The choice is yours.
But there’s more—now you can also customize the aggregated reports by choosing whether or not to:
- include messages from a single list or all lists
- include certain content, e.g. messages;aggregated statistics; an aggregated messages list; an inserted links list
- protect report access through a password.
New List overview
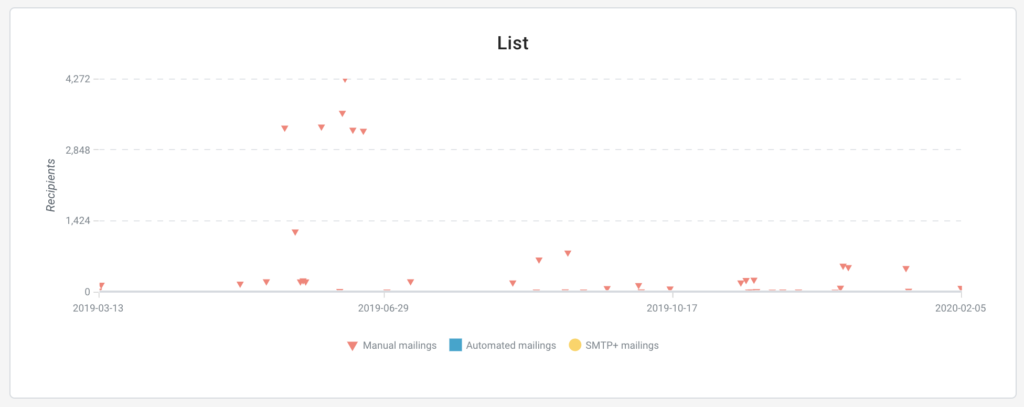
Let’s move on from aggregated reports to a section that brings back a list results overview. The new List overview section gives you an intuitive and immediate overview of:
- List, so that you can take a look at the proportions between the various manual, automatic, and SMTP mailing flows.
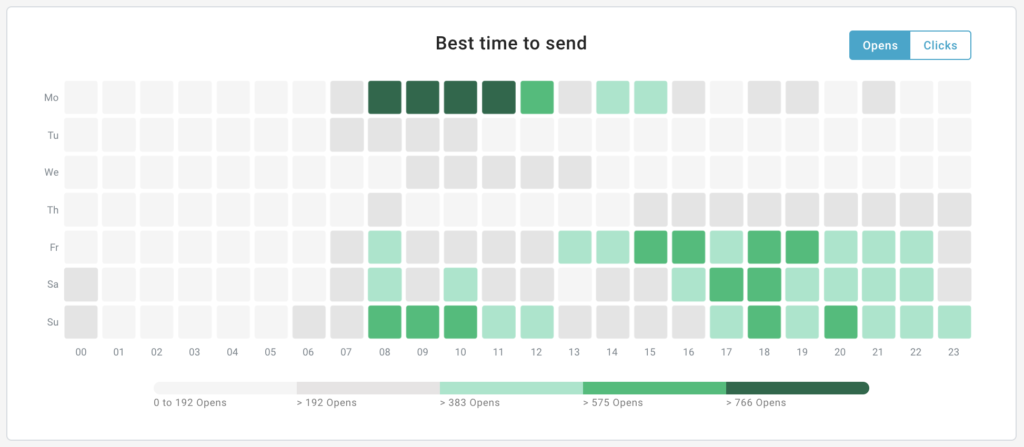
- Activity distribution, to see which days andweeks your recipients are more receptive and active.
- Penetration rate, which shows, through the funnel’s graphic representation, your message’s degree of penetration on the entire audience. It comes with a valuable comparison averaging the commercial sector target.
- Engagement, which is discussed above.
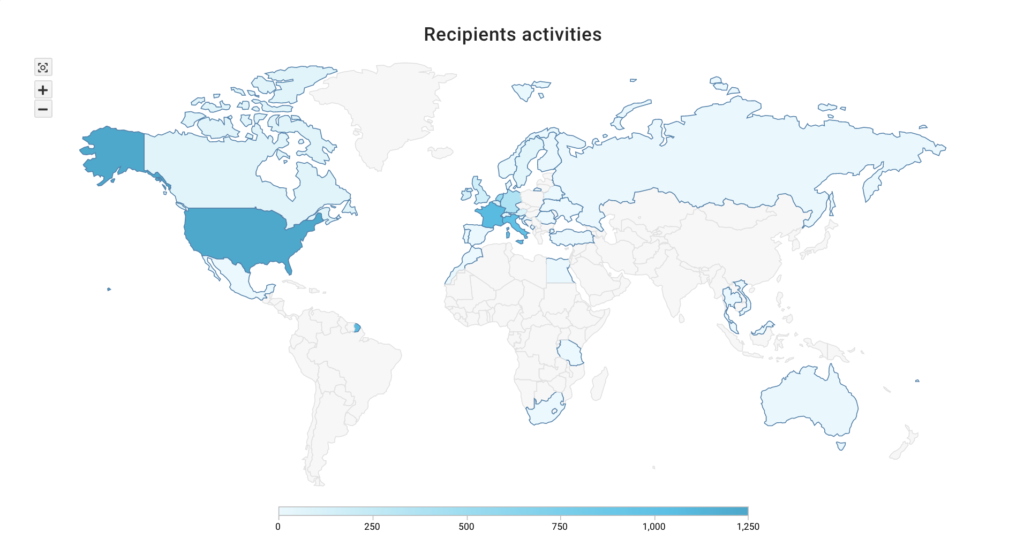
- Mailing geography, helps understand where users’ activities are distributed geographically, globally, or nationally. A heat map gives an account for the number of openings and total clicks of each country and region (the latter is available for Italy, Spain, France, and Denmark).
- Devices, to understand howopenings are distributed based on the device used.
- Registration, to get a picture of thedatabase’s evolution over time, with the possibility of filtering throughchronological detail choices.
Optimizedcalculation makes data even more precise
We’ve reviewed the calculation method of the rate of openings, clicks, and clicks on openings to provide even more accurate numbers and percentages, and to reduce any margins of error.
New notification center
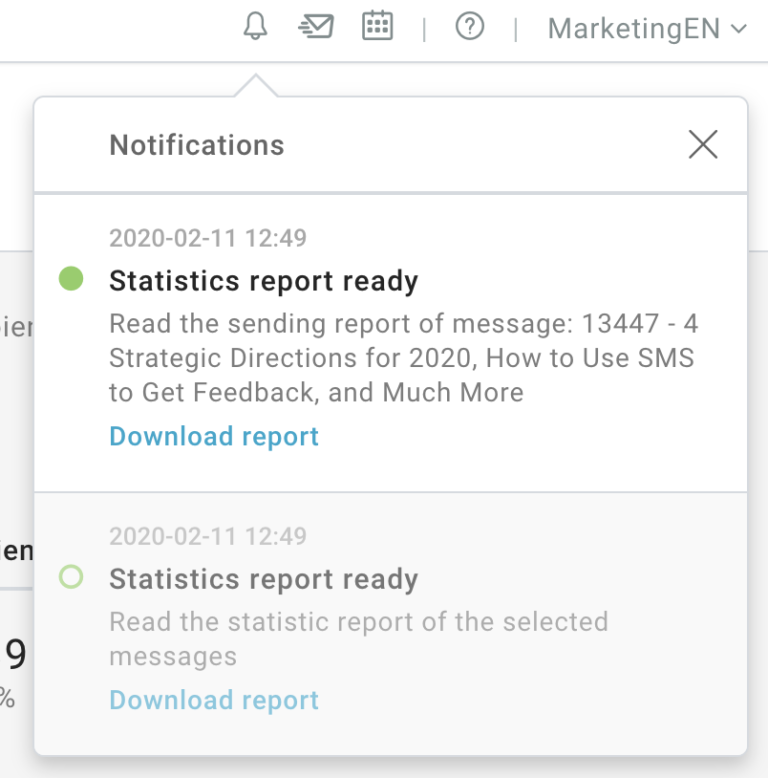
As you know, MailUp’s statistical reports are exportable in a CSV file with all the data and the main metrics. To optimize this activity, we’ve created a new notification center (the bell, top right) to notify you when the requested report is ready to download.
In summary
As mentioned, the new Statistics area is on a path of technological development that aims to provide companies with the tools to create campaigns. Such campaigns are based on data and results connected to behavior and each individual recipient’s degree of involvement.
Try it today. Request a free MailUp trial: you have 30 days to try all suite, sending, and reporting tools.