Email Marketing KPIs to monitor in 2021

When it comes to Email Marketing and when your goal is to structure effective email campaigns, adopting a data-driven approach is a must.
While in 2017 data-first strategies were taking their first steps in the world of marketing, with only 32% of marketers claiming to use them, in 2021 data has become the starting point to guarantee an effective and successful campaign.
But when it comes to monitoring, which of the fundamental metrics of Email Marketing can you simply not afford to overlook?

From developing integrations to strategic support, from creating creative concepts to optimizing results.
The 5 KPIs to monitor in 2021
The open rate indicates the number of emails opened with respect to the total number of emails delivered.
The open rate is mainly influenced by the first two components of the message that recipients see, enticing them to discover what the email contains. These are:
- the subject
- the preheader
How is it calculated?
(Number of opens / Emails delivered) * 100
How can it be improved?
By optimizing the effectiveness of the subject line: choose strong and impactful words that make recipients curious. Personalize the subject line and make it clear and specific. Work on the preheader so that it complements the subject line: make the most of the characters available and include a CTA.
Discover the 7 golden rules for writing an impossible-to-ignore subject line
Click-through rate (CTR)
The click-through rate is the number of clicks on links in an email divided by the number of messages delivered.
While the open rate depends on the effectiveness of the subject line, the click-through rate is determined by everything contained in the email, i.e. images, videos, and call-to-action copy.
How is it calculated?
(Number of clicks / Emails delivered) * 100
How can it be improved?
By running frequent A/B tests on CTA copy and style, content layout and the design used.
Find out how to do an A/B test: read the definitive guide
Click-to-open rate (CTOR)
The CTOR indicates the number of unique clicks with respect to the number of unique opens.
What are unique opens and clicks?
While total opens and clicks also count multiple instances of the same user (for example, a user who opens a message 10 times a day), unique opens and clicks only count users who have opened or clicked at least once.
The CTOR is the most accurate metric to measure the level of interaction with your messages, as it tells you how many users interact with your emails and land on the website instead of closing the message immediately after opening it. For this reason, the CTOR is also known as the reactivity rate.
How is it calculated?
(Unique clicks / Unique opens) * 100
How can it be improved?
Create a bulletproof CTA button and be creative in attracting clicks. Optimize the structure of your emails based on their purpose and improve the user’s experience of reading and enjoying the content by using modular design. This method allows you to create non-fixed structures and build your emails with content blocks that are reorganized in a different grid depending on the media query detected at that point in time.
Find out how to create modular emails with BEE
Unsubscribe rate
Knowing the number of people unsubscribing from your emails is just as important as monitoring the subscription rate: in a healthy database, the unsubscribe rate should remain below 2%, and in any case it should be below the number of new subscribers.
How is it calculated?
(Number of unsubscribed users / Emails sent) * 100
How can it be improved?
If this value rises or spikes, re-evaluate the content of your messages and how often you’re sending them, and run multiple tests to identify and fix the cause of the dissatisfaction.
Engagement rate
This measures users’ engagement and level of interaction with the emails they receive.
74% of marketers focus on qualitative metrics such as engagement
How is it measured?
Two different levels can be considered when measuring engagement in Email Marketing:
– the individual campaign, taking into account and analyzing the main on-mail metrics such as sends, deliveries, opens, clicks, unsubscriptions and spam reports
– the strategy, examining the campaign progress statistics and recipient interest over a given period of time to understand how healthy the database is.
How can it be improved?
If the engagement analysis reveals a significant number of inactive contacts in your database, develop a re-engagement strategy to reactivate these users. Remember: prompt action is crucial for the effectiveness of a reactivation campaign.
How to measure KPIs with the MailUp Statistics area
In 2020, the Statistics area of the MailUp platform was revamped and the method used to calculate open, click-through and click-to-open rates was revised to provide even more accurate numbers and percentages and further minimize any possible errors. In addition, new graphs were added to provide an even more detailed analysis of database composition and user engagement levels.
Let’s take a closer look at how you can take advantage of all the features of this area to get the KPIs you need.
Statistical reports at an individual campaign level
In the Statistics area, by accessing the list of sent messages, you can view reports on the progress of an individual campaign, broken down by:
– message, with statistics relating to the entire life cycle of the message, obtained by aggregating individual mailing data
– mailings, with statistics relating to each individual mailing.
In the Activity report section, you can view the following for both individual mailings and messages:
- opens, with details on unique opens (under Opens) and total opens.
- clicks, with details on the number of unique clicks (under Clicks), total clicks and click-to-open rate. In the Clicks report section, you can also view the Click Map, i.e. the total clicks and the click rate for the various components of the message (title, image, CTA button, etc.). This display allows you to understand where users click the most and which elements of the message need to be improved. Many campaigns aim to have the recipient scroll through the entire email, interacting with all the content, even items placed at the very end of the message. With the Click Map, you can understand the number and percentage of interactions logged for content further down the hierarchy, allowing you to evaluate if you need to change the layout of the email and remodel its design by establishing a more functional hierarchy or cutting down the content.
To get separate statistics for each element of the email, add a dummy parameter at the end of the URL that is different in each case; this unique parameter allows the platform to provide you with more accurate data. To find out more, check the MailUp manual!
- unsubscriptions, with the number of actual unsubscribers and clicks on the unsubscribe link.
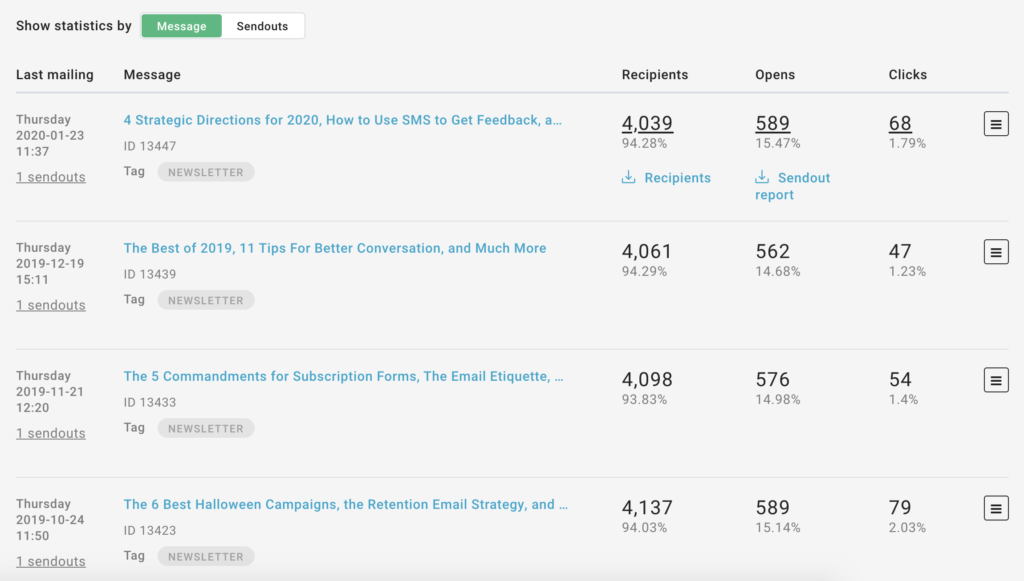
In the View activity section, by customizing the time period, you can view and analyze a graphical representation of how opens and clicks have changed over time. In addition, in the section dedicated to recipients, you can also take advantage of the individual recipient view, checking opens and clicks.
The data relating to opens and clicks applies to the total emails delivered (not sent).
Aggregate statistical reports
In a separate section of the Statistics area you will find the Aggregate reports, which allow you to aggregate the reports for different messages and create a single report that combines the results of the values recorded for various campaigns.
This report type also includes data relating to the open rate and total click rate.
By selecting the different reports created, you can also compare the results of your aggregate reports and compare the data recorded by the different campaigns to understand which ones performed best.
In addition to how easy they are to create, the advantage of aggregate reports is that they can easily be shared by means of a simple link with anyone who does not have access to the platform. To ensure enhanced security, you can set a password to access the data.
List overview
Opens and clicks can also be monitored in the Analysis and Comparisons area, designed to present all the statistics and reports relating to the performance of the entire list in one place. Here you will find the Recipient activity distribution chart, which allows you to view the open and click rates of recipients belonging to a given list by day and time slot.
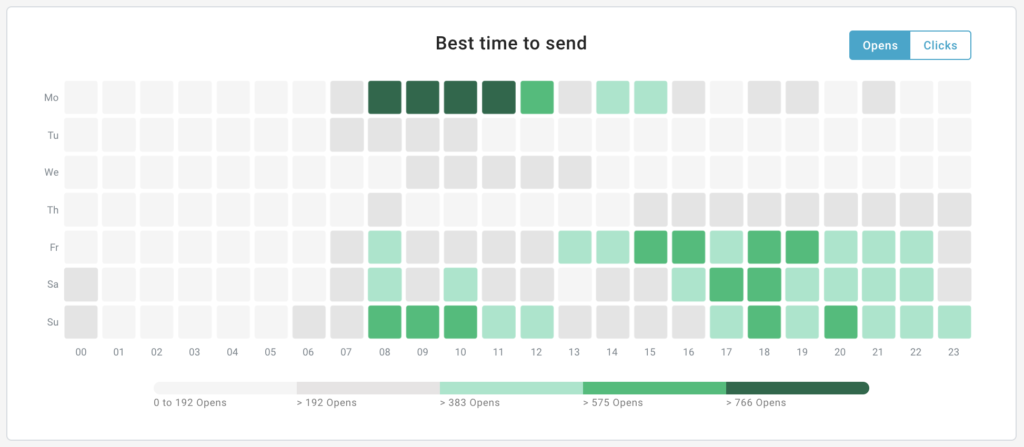
Thanks to this information, you can understand which times of day your users are most reactive and orient your mailing approach according to this data. Having a good understanding of the right timing for mailing based on your database is undoubtedly an advantage, because it allows you not only to get to know your database better in terms of behaviors and preferences, but also to encourage an increase in opens, clicks, and interactions with your mails.
Data relating to the number of unsubscribers and the composition of your database can also be consulted in the Subscribers section of the List overview, where you can view changes in the number of subscribers and unsubscribers over time.
Recipient engagement
The latest update to the MailUp Statistics area added information on recipient engagement to the Analysis and Comparisons section, as explained in this article.
Finding the engagement rate of your database and monitoring its progress over time is simple and intuitive thanks to the help of the graphics:
- Recipient engagement snapshot, which provides a snapshot of your database, dividing recipients into Very active, Active, Not very active, and Inactive based on their interactions.
- Recipient engagement in a selected period, which allows you to find out the number of new subscribers in a customizable time interval and their reactivity, with the option to check the percentages of active, very active, not very active or inactive users.
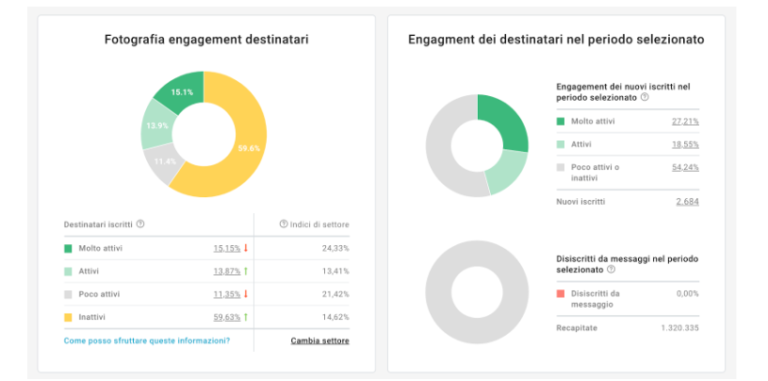
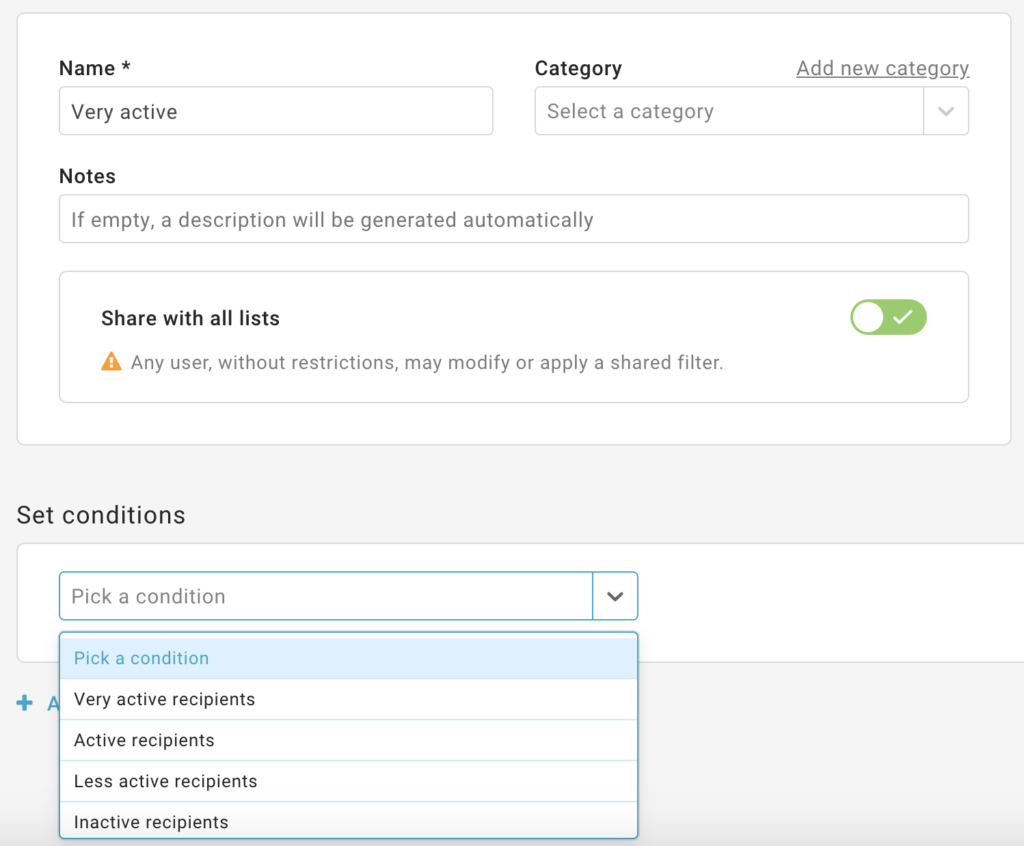
The information highlighted by these charts allows you not only to find out your database’s engagement rate, but also to use this information to create segments of recipients who share the same level of engagement. How? Using the Engagement filters. By selecting a series of criteria and conditions relating to the engagement rate, you can segment users according to their engagement and create tailored campaigns, such as a reactivation campaign for inactive users.
How to interpret the data obtained
To understand if you need to start worrying about your campaigns or if you can rest easy at night, you can compare the data with the average values of those metrics in the world of Email Marketing:
- Average open rate: 18.0%
- Average click rate: 2.6%
- Average click-to-open rate: 14.1%
- Average unsubscribe rate: 0.1%
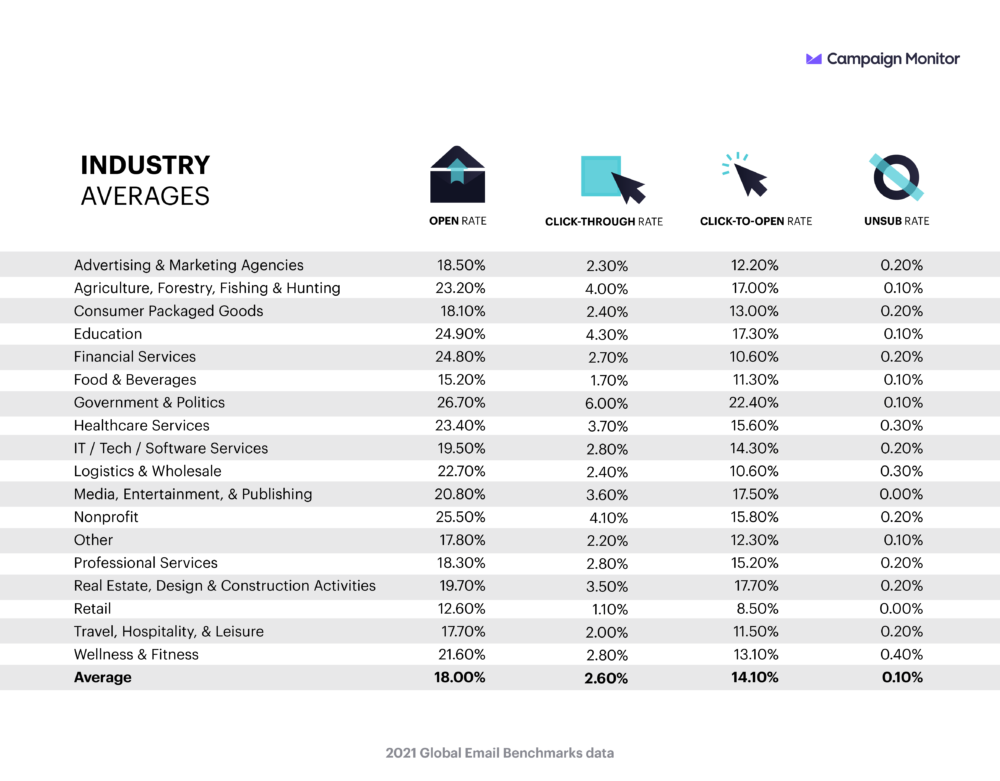
Source: Campaign Monitor
However, these values are a general overview that includes every type of business and sector.
For an even more precise and useful comparison, we recommend that you once again take advantage of the features of the MailUp platform: in the Configuration section, you can configure the business model and the sector to which your company belongs. This way, you can compare the results of your campaigns with the average performance of your business sector.
With the Recipient engagement snapshot chart, you can also compare the engagement of your users with the engagement of other key players in your sector, giving you an even more accurate idea of how healthy your database is.
Conclusions
Determining which KPIs to keep a constant eye on is the key to gaining control over your Email Marketing campaigns in an uncertain and unstable situation.
As you’ve seen, measuring these metrics and monitoring the progress of your campaigns is easy and instant with the features offered by the MailUp Statistics area.
If you haven’t experienced these benefits yet, request a free, no-obligation trial and discover the platform’s full potential.