Timing and Pressure: how e-mail timing impacts the recipient

We are pleased to present our latest focus. This is the first of the new series—MailUp Data, which is entirely dedicated to the reception and opening of e-mails by recipients.
What’s the goal? We want to conduct a quantitative and qualitative analysis on the daily, weekly, and yearly timing when customers and prospects receive and open company messages.
In addition to timing, the study focused on the so-called pressure, i.e. the number of messages a user receives in a given period, and to what extent this affects opening, click, and unsubscription rates.
The study analyzed a sample of almost 20 million recipients. It took into consideration only the mailings from the MailUp platforms that were continuously active for 18 months, from June 1, 2018 to January 1, 2020.

From developing integrations to strategic support, from creating creative concepts to optimizing results.
Timing: seasonality
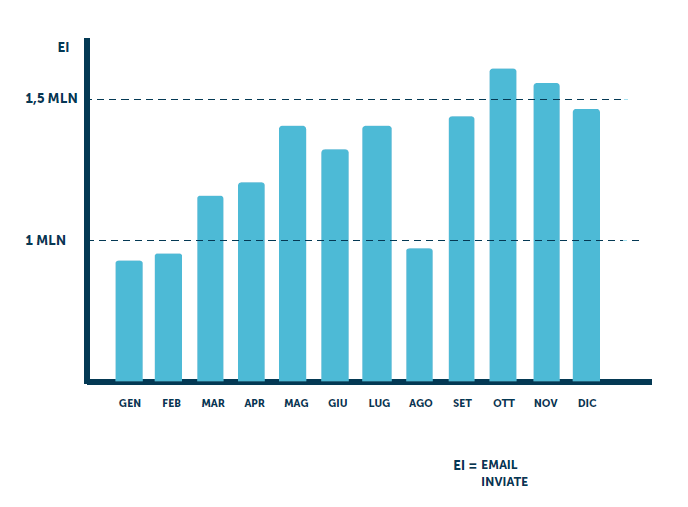
Email Marketing activity increases during the last months of the year. Seasonal reports show that over 9% of the total number of mailings take place between September and December, with October leading (10.79%). This seems to stand between the long summertime (characterized by a general lower activity by companies) and the beginning of a cycle rich in holidays and related purchase opportunities (Halloween, Black Friday, Cyber Monday, and Christmas).

If we shift the activity focus from companies to the e-mail recipients, then the ratio turns upside down: the opening percentages drop during the last months of the year and increase when the sending volumes are smaller.
The case of January is paradigmatic: the lower concentration of mailings of all the 12 months (5.5%) corresponds to the highest opening rate (31.8%).
The only exception is August. A drop in activity of both companies and recipients, the latter due to an opening rate clearly lower than average (23.7%), characterizes this month.
Albeit with natural internal differentiations, average deviations, and countertrends the analyses by the individual sector confirm the general trends that we have depicted so far.
Timing: weekday and hour
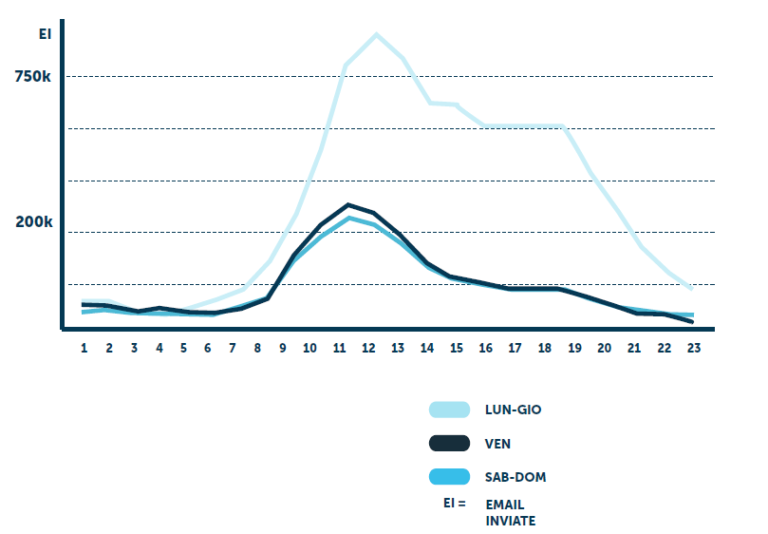
The analysis by week and by hour offers us a rather clear picture on the Email Marketing market: companies concentrate their mailing on weekdays, at the expense of the weekend, when volumes drop significantly.
Companies prefer the morning hours, which record the most intense activity. The time around 10–11 a.m. represent the peak within the 24 hours.

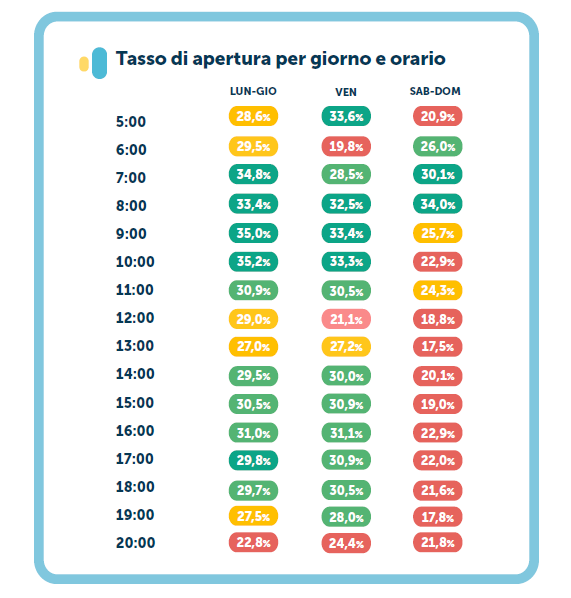
On the other hand, the recipients’ activity shows that the highest opening percentages are concentrated on days between Monday and Thursday around 9 a.m. (35% openings) and 10 a.m. Statistically, therefore, these hours of the day when the recipients are most receptive to e-mails are the most favorable time intervals for the companies.
The opening times analysis confirms this observation. The study shows that between 11 and 15 from Monday to Thursday, the recipients take less time to open the e-mail. In other words, at the turn of lunchtime, between the last hours of the morning and the first hours of the afternoon, the interval between the delivery of the e-mail and its opening is shorter.

Understanding the right time to send e-mails is indeed an advantage, which will turn into higher opening rates. If, zooming in, we also intend to optimize on-email metrics (click and conversion rate), then the advice is to work on the graphic, technical, and strategic aspects of Email Marketing.
Pressure: its impact on recipients
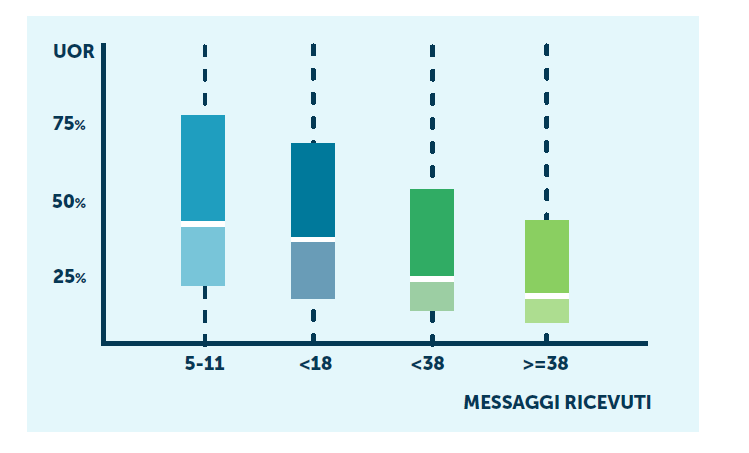
The pressure analysis gives us a picture in which there are no obvious differences between DEM and Newsletter. Pressure means the number of messages that a recipient receives in a given period. By looking at the metrics, it is clearly a key factor. Let’s consider only the recipients who opened the e-mails. We note that an increase in pressure has a positive impact on the total opening rate (OR), but the impact is negative (on UOR) if we consider all recipients—even those who have not opened e-mails

This observation is, therefore, very pertinent. The greater the pressure the company puts on the recipient, the greater the number of overall interactions with the e-mail is. At the same time, though, the number of readers of the single e-mail decreases. The same dynamic occurs with click rates.
These are patterns and general trends that certainly change and show singularities in each distinct commercial sector.
In summary
As we have often done in our studies, here, too, we want to emphasize the importance of engagement. This parameter considers metrics as interconnected and interdependent. In fact, engagement measures the success of an e-mail message shared with recipients, telling companies the extent and degree to which people interact with a single e-mail or a set of e-mails.
In this regard, we remind you that MailUp offers a Statistics area that has been newly designed and enriched with new reports to measure the progress of your past campaigns and improve those to come.